返回列表 发帖

[技术分析] Perfect Wave - 2012-1/2 (I)

I am starting a new thread for 2012's first half year (Jan - Jun), including EUR, SP, Gold, and JPY.  My previous wave counts can be found from:
http://www.yayabay.com/forum/thread-165734-1-1.html

Elliott Wave reference can be found from:
http://en.wikipedia.org/wiki/Elliott_wave_principle

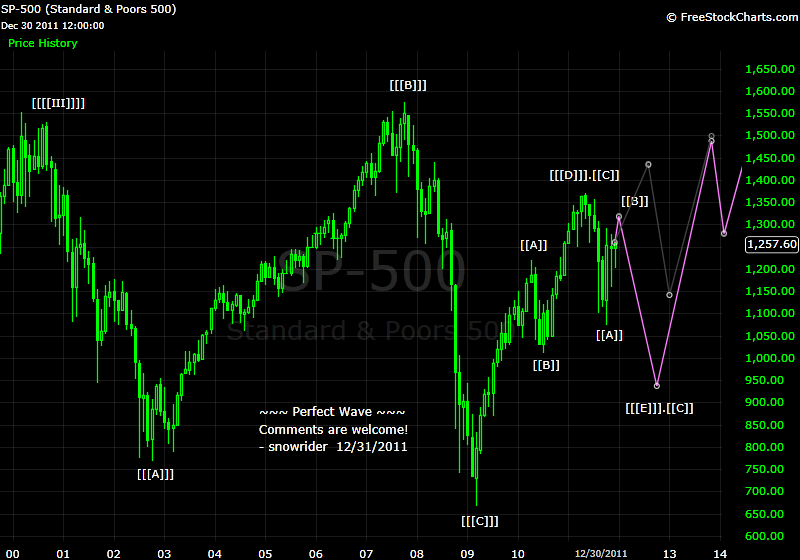
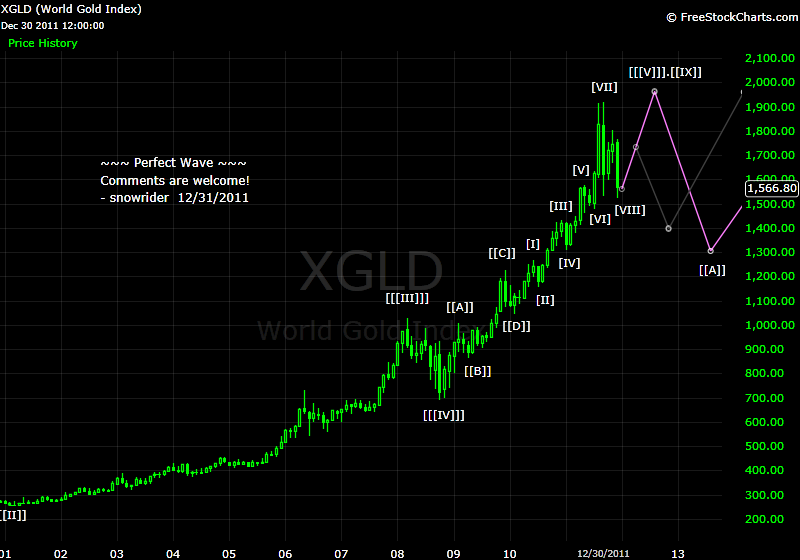
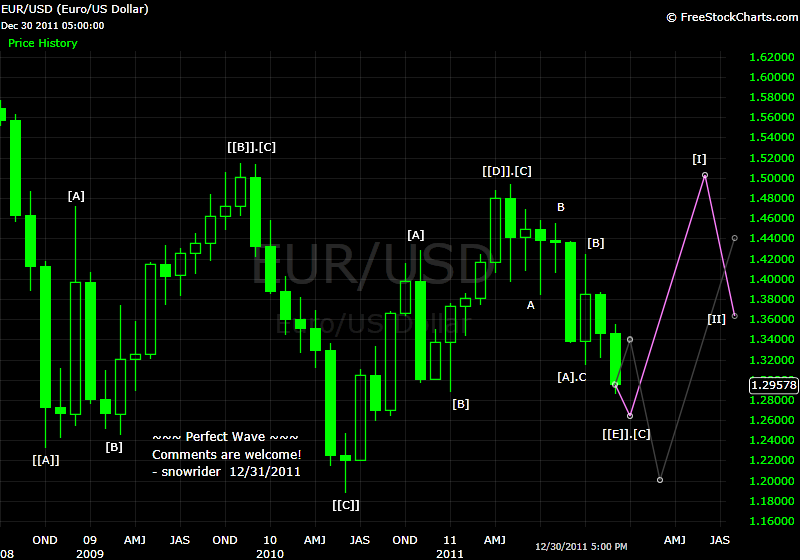
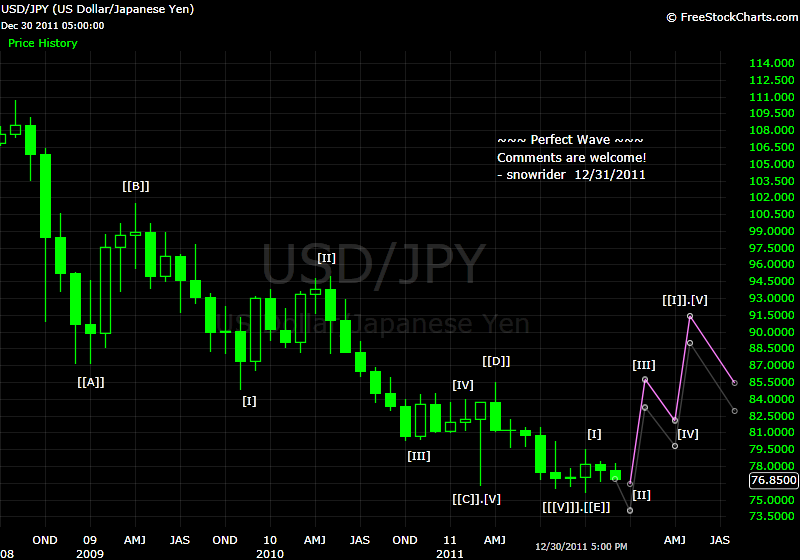
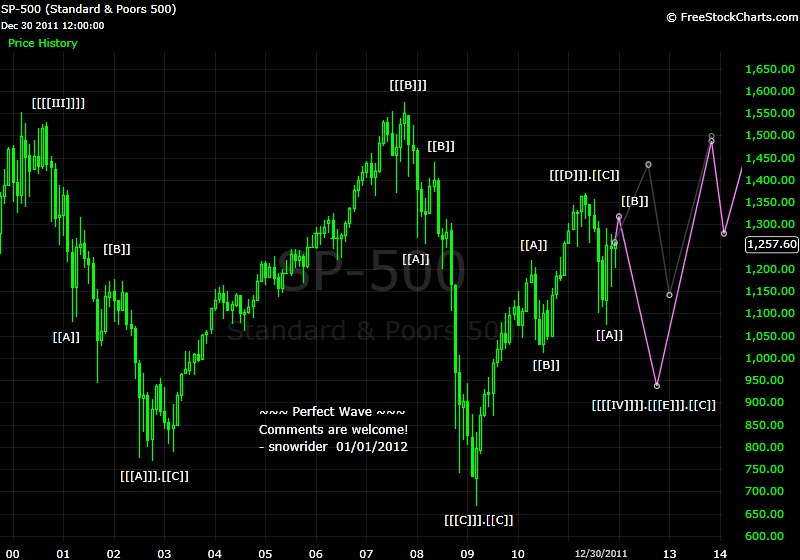
My labeling for wave degrees in different time frames:
Monthly - [[[I]]], [[[II]]], [[[III]]], [[[IV]]], [[[V]]], [[[A]]], [[[B]]], [[[C]]]
Monthly - [[I]], [[II]], [[III]], [[IV]], [[V]], [[A]], [[B]], [[C]]
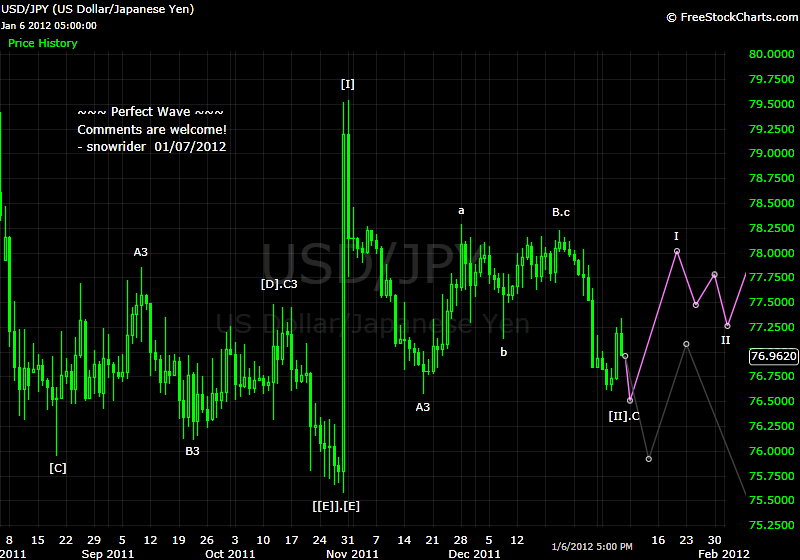
Weekly - [I], [II], [III], [IV], [V], [A], [B], [C]
Weekly - I, II, III, IV, V, A, B, C
Daily - 1, 2, 3, 4, 5, a, b, c
Daily - _1, _2, _3, _4, _5, _a, _b, _c
Hourly - __1, __2, __3, __4, __5, __a, __b, __c

My labeling for wave formation in a segment = Wave Name + Wave Formation
For example, [A3] = 3 segments in a wave [A]
For example, [A3][B3][C5] = 3-3-5 formation for waves [A][B][C]

My labeling for zigzag is the combination of R.N. Elliott's classical labeling and my wave formation labeling.  DO NOT USE R.P.'s W-X-Y(-X-Z) labeling because it creates confusion and lacks the flexibility of changing wave counts.

I am getting lazy on updating the counts because I don't know how many people are following.  I might stop writing this at anytime.  If you are an audience of my threads, please PM me to let me know so that I won't forget to keep you updated if I stop writing.
01/01/2012 Monthly Charts

Comments are welcome!


Not a bull, not a bear, I am just a wolf ... 偶還是習慣稱行情漲為紅盤跌為慘綠
最大能跌到950? 有人说1100啊
not4weak 发表于 2012-1-1 14:45


真的呀!?  1100 和 950 不是意義上都差不多嗎?
I just noticed that I had a typo in gold's month chart.

The final target of gold's super bull market could be $1,960.  The extension wave [[[V]]].[[IX]] should be labelled as [[[V]]].[[E]].[IX].
Not a bull, not a bear, I am just a wolf ... 偶還是習慣稱行情漲為紅盤跌為慘綠
雪骑元旦就开始乘风破浪的
dvork 发表于 2012-1-1 15:25


偶是很鬱悶
沒好雪可滑
去太浩湖的機票又不能退(要重罰)
只有祈禱盼望暴風雪在二月前能來
去950的红线一看就知道不可能。。。因为TLT还在120徘徊。。。
如果SP500在两个月内从1300跌到950,不会还有 ...
seagal 发表于 2012-1-1 17:00


海娃 - 偶也知道2個月內從1300到950不太可能 偶新年開盤後還要繼續做多頭哩 你沒看紫線有個小凸凸 偶做完那個小凸凸後才做空頭 950目標是一路到年底 (全都是瞎矇胡扯的)
怎么也得等tlt跌到95以下再说。。。
seagal 发表于 2012-1-1 18:26


海娃 - 偶不trade TLT所以偶不知如何猜TLT 但偶知道 偶沒說過SP會在2個月內從1300急殺到950 大概是你看錯或聽錯了吧  
01/01/2012 SP Monthly Chart Again

An alternative count:

[[[A]]].[[C]] becomes [[[[IV]]]]
[[[B]]] becomes [[[[V]]]]
[[[C]]].[[C]] becomes [[[A]]]
[[[D]]].[[C]] becomes [[[B]]]
If this is the scenario, we are in [[[C]]] now, and it could go to 550-650 when it finishes.


Not a bull, not a bear, I am just a wolf ... 偶還是習慣稱行情漲為紅盤跌為慘綠
Waves [[[A]]]-[[[B]]]-[[[C]]] are not 3-3-5.  [[[A]]] is definitely a 3.  [[[C]]] is highly possible a 3 too.  [[[B]]] could be a 3 or a 5 depending on how we see it.


[[[D]]] and [[[E]]] are part of [[[[IV]]]], where the assumption is that they are in a wave-4's abcde triangle.  (See above chart.)

The purple line has the assumption that [[[A]]]-[[[B]]]-[[[C]]]-[[[D]]] have completed, and now we are in [[[E]]] to form [[[[IV]]]].  An alternative count is that [[[A]]]-[[[B]]]-[[[C]]] has completed the [[[[IV]]]], and we are in the early stage of [[[[V]]]].
Not a bull, not a bear, I am just a wolf ... 偶還是習慣稱行情漲為紅盤跌為慘綠
where does your count put the highs in on the sp? i reckon we are going to 1330 ish before trading down into the summer making a decent bounce into end of year


Rothschild - I would guess that SP spot index 1320 area could be where the reversal starts.  We need to pay attention if SP ever moves to that area to see if there is any sign of exhaustion.
Not a bull, not a bear, I am just a wolf ... 偶還是習慣稱行情漲為紅盤跌為慘綠
你那红线标的,从1300跌到950,我想知道你怎么想的?你标在12到13之间的。。。
不是明摆着1个月内 ...
seagal 发表于 2012-1-1 23:59


海娃你真該配副眼鏡好好看清楚 偶寫著 Monthly Chart 意思就是月線圖 12是2012 13是2013
不要太緊張!  
师弟一看要跌的帖总是显得很着急。。。。。。。
棋王 发表于 2012-1-2 00:36


海娃好像很緊張
01/08/2012

Comments are welcome!


Not a bull, not a bear, I am just a wolf ... 偶還是習慣稱行情漲為紅盤跌為慘綠
20120109 DJIA Worst Scenario


Quote from jas_in_hbca:

Long term EW count question.

Could 1987 be a end of wave 1, (approx) 2000 end of wave 3,
2008 end of wave 5 ?

If so, then could 2009 bottom be wave A , 2011 top end of a 'B' ?
and where would a projected wave C end ?  

Thanks !


jas_in_hbca - It could be.  As I believe and mention many times that anything is possible.
With that scenario, we are going to enter a long term bear market soon.
That bear market could have 2.5 more years to go, and it's final destination of the bear movement will be after falling below 2009's low.

Not a bull, not a bear, I am just a wolf ... 偶還是習慣稱行情漲為紅盤跌為慘綠
本帖最后由 snowrider 于 2012-1-10 10:11 编辑
20120109 DJIA Worst Scenario
这和你上面的SP的图不大一样呢?


thirdwheel - 這當然不一樣 這張是道瓊指數幾十年的對數座標 有朋友問是否可以如何如何算波 偶回答他可以 並標示出那種算法的可能走法 當然短期日線走法仍然照偶們原來的算法在運行 所以一切是 under control
Not a bull, not a bear, I am just a wolf ... 偶還是習慣稱行情漲為紅盤跌為慘綠
返回列表